Stochastics divergence, Stochastics RSI and Stochastics momentum index, these three indicators is a similar and supplementary indicator of the stochastics indicator.
Stochastics indicator has two lines (one is the Fast line which is black color and second is the slow line which is Red color in this chart).
Crossover of the two lines, tells you the direction of the trend and gives you buy and sell signals.
Stochastics indicator setting
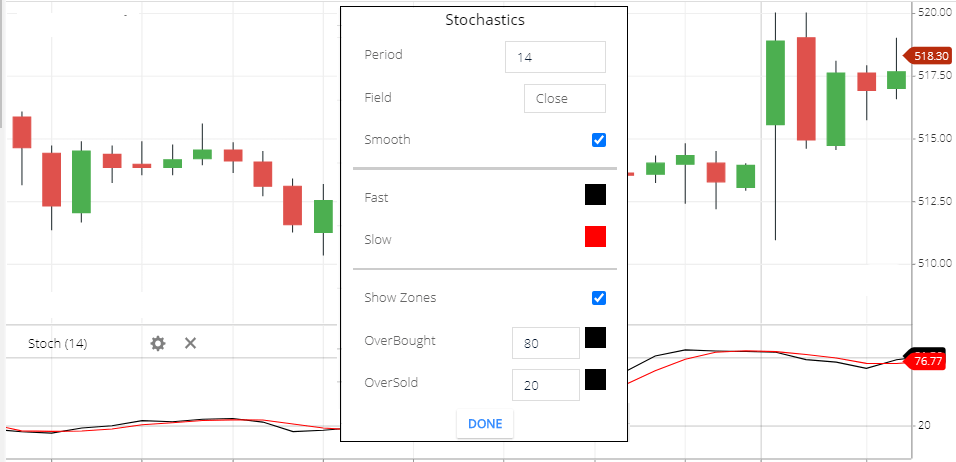
- Period: The default period of this indicator is 14. this means the 14-period share price will take to calculate this indicator.
- field: field of this indicator is ‘close’ this means the closing price will take to calculate this indicator. other options also available like ‘open’ ‘close’ ‘high” low’ this means the opening price of the period, High price of the period. etc etc.
- Smooth: use this option for the smoothness of the indicator.
- Fast: This is the fast line color setting.
- Slow: slow line means, this is the SMA line of the Fast line.
- Show Zones: this will highlight the overbought and oversold zone.
- Overbought: this is the overbought zone level. the default overbought zone level is 80. this means when the indicator line will oscillate above the 80 level, then this will display as an overbought zone.
- Oversold: This is the oversold zone level. the default oversold zone level is 20. this means when the indicator line will oscillate below the 2 level, then this will display as an oversold zone.
Stochastics Indicator tells you
- When the Stochastics Indicator lines are below the 20, which indicates the stock price is in the oversold zone.
- When the stochastics indicator lines are above the ’80’ line, this indicates the share price is in the overbought zone.
- also, it has 2 lines,( fast line and slow line) fast line color is black, and the slow line color is Red. so when the black line above the Red line, this tells you the share price is in the bullish direction.
- when the red line is above the black line, this indicates the share price is in the bearish direction.
Stochastics indicator trading strategy
- The simple strategy is to buy at an oversold zone and sell at an overbought zone.
- when the indicator lines are below the 20 level. there is a chance that share price reversal may soon. if the Black line is crossing the Red line and started moving up, then you can take a buying position.
- when the indicator lines are above the 80 level. there is a possibility of the share price reversal. if the Red Line is crossing the Black line and moving down then you can take a short sell position.
- sometimes the share price is rising and touching the higher high and the indicator lines are not touching higher high, so this is the bearish divergence. share price reversal may soon. in this situation, you can take a short sell position.
- If the share price is falling and touching lower low and this indicator lines are not touching lower low, this is the bullish divergence. in this situation, the stock prices may rise soon. if the stock price is started rising then you can take a buying position.
Conclusion
In a simple word, the Stochastics Indicator helps you to find price movement direction and the buying selling positions. so that you can enter and exit from the stock at the perfect time.
*Read Related Post for more information.