In a simple word, The mass index helps us to identify the trend reversal. When volatility increasing then indicator can give the signal for a trend reversal.
This indicator is a little similar to RSI or intraday momentum index etc. In this indicator after touching some level indicator line will reverse and the share price trend can change.
Mass index indicator setting
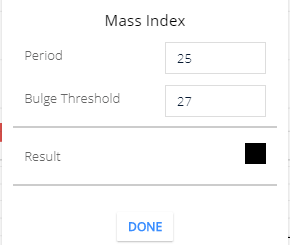
- Period: the indicator calculation will base on the er of the period. the default period is 25. this means 25 share price candlesticks price will take to calculate this indicator.
- Bulge Threshold: this is the indicator level , from this level indicator line will start reversing. if the indicator line is reversing after touching the 27 levels of the mass index indicator, then the share price will change the trending direction.
- Result: this the color setting of the indicator line. The default color is black but you can change this color.
Mass Index indicator calculation
Formula is:
Single EMA = 9 EMA ( high -low)
Double EMA = 9 EMA of singal EMA
EMA Ratio = Singal EMA / Double EMA
EMA SUM = 25 period SUM of EMA Ratio
Mass Index = EMA SUM / Double EMA

here, EMA = Exponential moving averge
25 period is the default period of the indicator, you can change period number in while setting this indicator.
What Mass IDX tells you
In a trending market share price will rise or fall in a Zig-Zag pattern. in a bearish trend when the share price will fall in a zig-zag pattern, it means the price will fall much then will try to rise the price or price will be volatile for some time. then again share price will start falling. this is the pattern of stock falling.
in bearish trend the indicator will identify when the share price is falling in a zig-zag pattern. and after falling the share price when the share price trend will change and share price will increase or price will be volatile then the indicator line may rise up and if indicator moving down after touching the Bulge Threshold level (27 levels) then share price may fall again.
In the bullish trend when the share price is rising in a zig-zag pattern when the big trend will change this indicator will touch the Bulge Threshold (27 default level although if your stock price is not touching 27 levels then you can change Bulge Threshold level.) and when indicator line will start moving downward direction then share price can change trend the direction.
Mass index indicator trading strategy
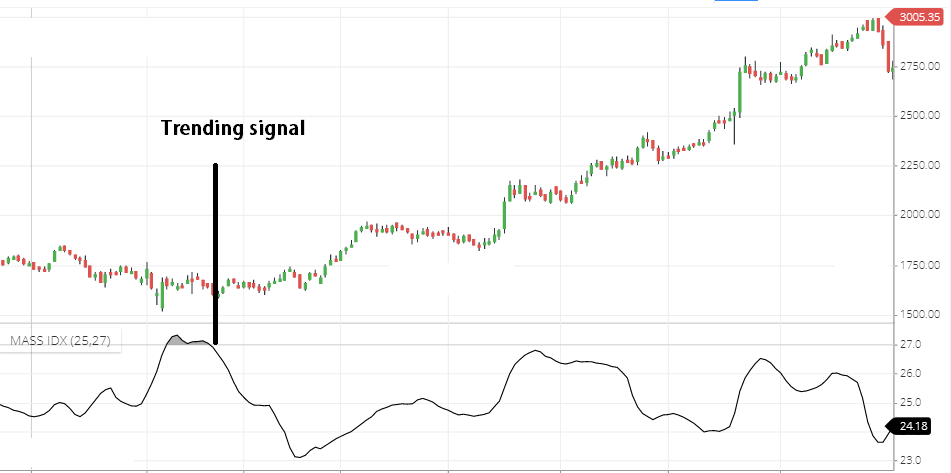
See above the chart, indicator touches 27 level and when moving downward direction after crossing 27 levels, the share price is in trend.
Mass IDX indicator will not tell you trend direction, in bullish or bearish trend share price is give similar signal like this.
You Can use the MACD indicator with mass IDX, so Mass index will show you trend and MACD will confirm, the trend is bullish or bearish. also, the MACD indicator shows you buying and selling positions.*
Conclusion
Mass index is used to help us, to identifying the trend. this will not show trend direction. use this indicator combination with other indicators,which can identify the trend direction.
*Read Related post for more information.