Price Volume trend (PVT or Price VOL) Indicator tells you to share price trend and the force behind the trend.
PVT indicate the accumulation and distribution of the share. Changes in the share price that show you Accumulation and distribution of the share. And the trading volume of the stock tells you the force behind the price movement.
Price Volume Trend Setting
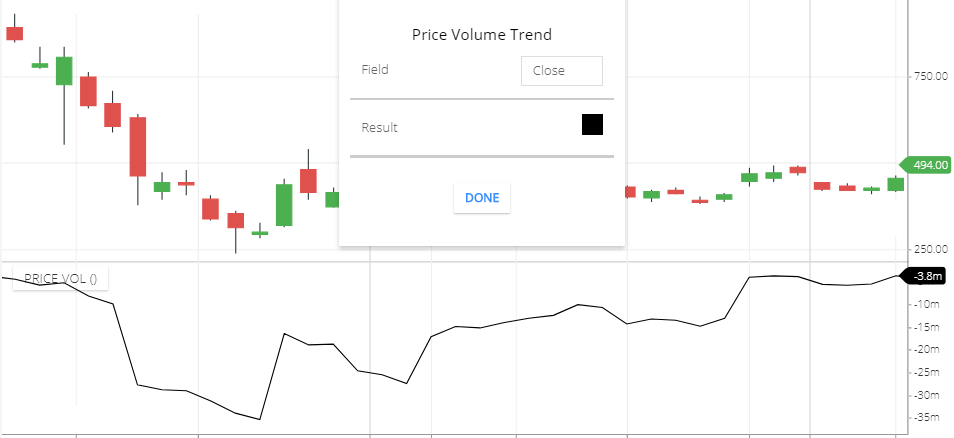
- Field: The Field price is will take to calculate PVT Indicator. Default Field is ‘close’. This means the closing price of the period will take to calculate this indicator. Other field types available also. Like, opening price period high price, low price of the price, etc etc.
- Result: This is the indicator line color setting.
PVT indicator Calculation
If the current closing price is above compare to the previous period closing price. Then the volume will be multiplied by the percentage of increase in the price, then the result will be added to the previous period’s PVT value.
If the current closing price is below compared to the previous Period closing price. The volume will be multiplied by the percentage of decrease in the price, then the result will be added to the previous period’s PVT value.
Price Volume Trend Trading strategy
- When the share price and indicator line moving upward direction, this is the signal for an uptrend. Share prices can rise more.
- when the share price and Indicator line moving Downward direction, this is the signal for a downtrend, the share price can fall more.
- If the share price is touching lower low high and indicator line isn’t touching lower low or moving flat or moving upward direction. This is the bullish divergence. Share prices can start rising.
- If the share price is touching higher high and indicator line isn’t touching a Higher high or flat or moving downward direction. This is the bearish divergence. Share price can fall.
You can use this Indicator in conjunction with other indicators like RSI, MACD, Alligator.
Conjunction with RSI
When the price volume trend is moving upside direction, a buy signal showing this Indicator. And in the RSI Indicator, if the RSI line is moving upside & crossing the 50 level. Then you can buy the stock. Because both Indicators are giving the same Signal. Which is reliable for trading.
When PVT is showing a selling signal. And in the RSI Indicator, the RSI line is moving Downward and crossing the 50 level. Then you can sell the stock.
Combination with Alligator Indicator
If this Indicator is giving buying Signal. And in the alligator Indicator, if the lips line is crossing above the teeth and jaw line, this is the buying Signal in alligator Indicator. So when both the indicator is giving the buying signal. Buy the stock.
If this indicator is showing a sell signal. And in the alligator Indicator. If the jaw line is crossing above the lips and jaw line , and moving downward direction then this is the selling signal.
limitations of this Indicator
Finding The divergence of the share price and Indicator line is too hard. Because sometimes it shows little divergence and then the Indicator line is started moving following the share prices.
it’s easy to finding divergence in the old chart but in the live market not that easy to find divergence.
Conclusion
Price Volume trend used to tells, the strength of the share price trend. It’s show trend, the divergence of the share price that helps to Trade. for better trading signals use conjunction with all the indicators as I mention above in this article.
*Read Related Posts for More information.